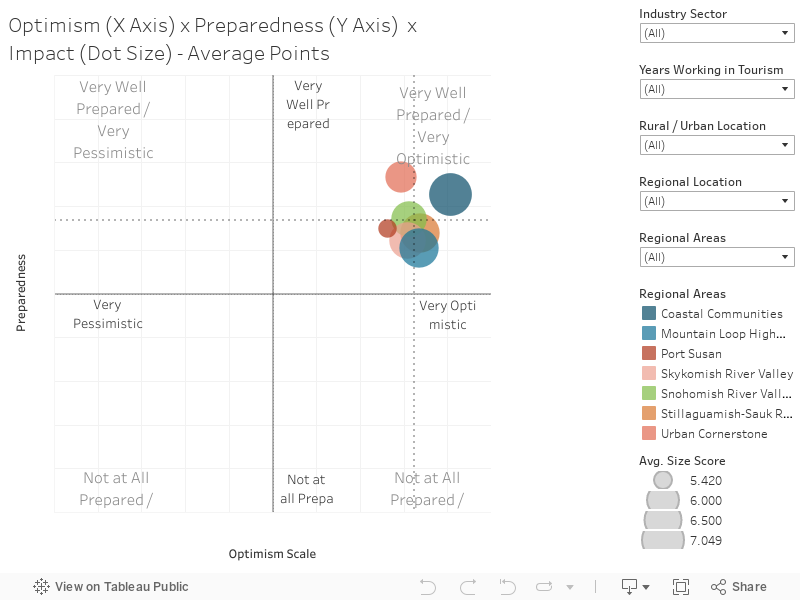
This chart combines responses to three questions to create an interactive scatter plot. The chart is structured as follows:
- X-Axis is the response to the question ‘How optimistic do you feel about the potential for tourism development in the following regional areas’. The scale was: -5 = very pessimistic; +5 = very optimistic (If respondents were unsure, the could record ‘Don’t know’)
- Y-Axis is the response to the question ‘In your view, how well prepared and organized are the communities and stakeholders to capitalize on a growing tourism sector within the following regions?’. The scale was: -5 = Not at all prepared; +5 = Very well prepared. (If respondents were unsure, the could record ‘Don’t know’)
- Size of the dot is the response to the question ‘How big an impact do you think the implementation of the Strategic Tourism Plan could have on the tourism sector in the following regions over the next 5 years?’ The scale was 1 = Negligible or zero impact; 10 = Very significant impact. The larger the dot, the greater the impact.
This chart presents the average results based on all respondents. There are filters on the right-hand side where you can explore the responses by different cohorts of survey respondents.