
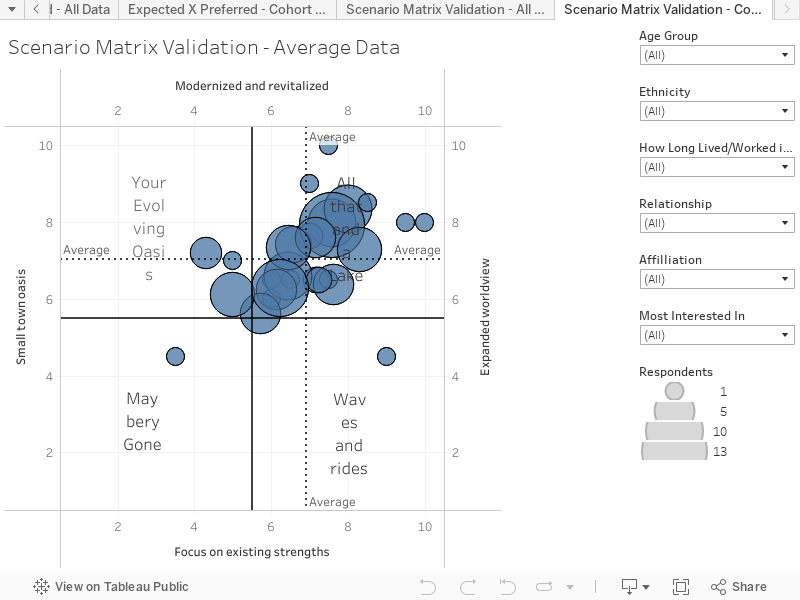
This chart provides a method to validate the preferred future created via the heat maps. This ‘Scenario Matrix Validation Chart’ is created by building a preferred future from the answers to the ‘Important Themes’ questions. These ‘Important Themes’ questions are subsets of the scenario axes, and by recombining each person’s answers we create a unique X, Y average. This approach generates a notional Preferred Future, but one based on likely response to issues and expected behaviour in real-life. This provides a validation of the Preferred Future response based on the heat map diagram.

Heat-map – Scenario Matrix Validation Chart – Cohort data
Key things to note:
- Overall the pattern reflects the All Data chart, which is to be expected.
- This cohort analysis reveals that there is a common view on the key issues, and this view is shared between various cohort groups, The outlier points are generally cohorts of just one person.
More Information
For more information about the City of Smithville Community Visioning project, please contact:
Nickie Lee, Assistant City Administrator
City of Smithville
107 W. Main St
Smithville, MO 64089
Tel: 816.532.3897
nlee@smithvillemo.org