
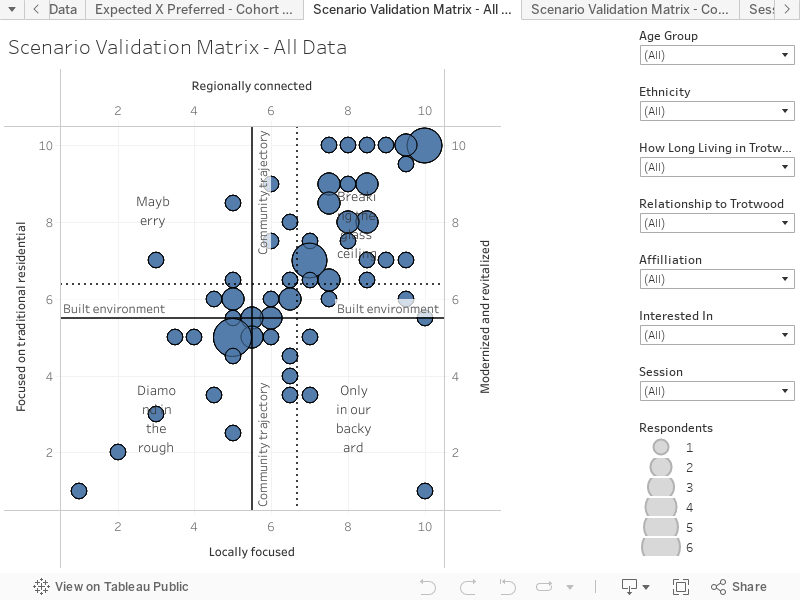
This chart provides a method to validate the preferred future created via the heat maps. This ‘Scenario Matrix Validation Chart’ is created by building a preferred future from the answers to the ‘Important Themes’ questions. These ‘Important Themes’ questions are subsets of the scenario axes, and by recombining each person’s answers we create a unique X, Y average. This approach generates a notional Preferred Future, but one based on likely response to issues and expected behaviour in real-life. This provides a validation of the Preferred Future response based on the heat map diagram.

Heat Map – Scenario Matrix Validation Chart – All Data
Key things to note:
- Of interesting note in this chart is the strong concentration of responses within the ‘Breaking the Glass Ceiling’ scenario.
- The dotted line on the matrix represented the average X,Y point of all responses. The size of the circle in the chart represents the number of responses in that specific location.


More Information
For more information about the City of Trotwood Organizational Strategic Plan project, please contact:
Cheryl D. Wheeler, Assistant to the City Manager
City of Trotwood
3035 Olive Road
Trotwood, OH 45426
Tel: 937.854.7215
cwheeler@trotwood.org