
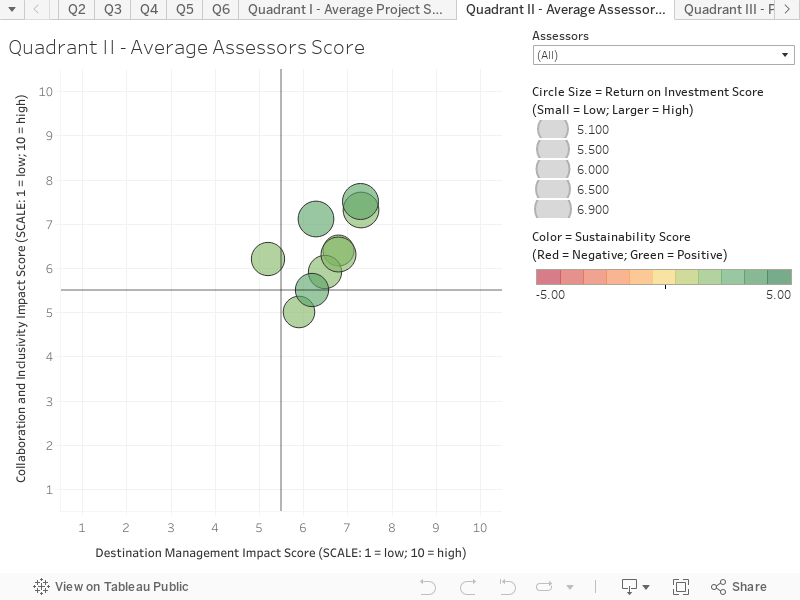
This chart shows the average scoring result for all the Assessors. These are their individual average score across all the projects. This chart is produced to help understand if there is any inherent bias between Assessors.
Quadrant II – Average Assessor Scores
Key things to note:
- The Assessors are generally clustered close together, in the middle of the quadrants, and colour and size range. This suggests that overall, there was no one Assessor who was an ‘outlier’ in terms of the application of the scoring system.
- This process helps Assessors think about the full range of the scoring scale, which will improve the ability to be able to separate projects.
More Information
If you have questions about the Tillamook County Tourism Investment Strategic Action Plan project, please contact:
David Beurle, CEO Future iQ
Phone: + 1 612 757 9190
david@future-iq.com