Quadrant III – Project x Assessor Scores

Quadrant III – Project x Assessor Scores

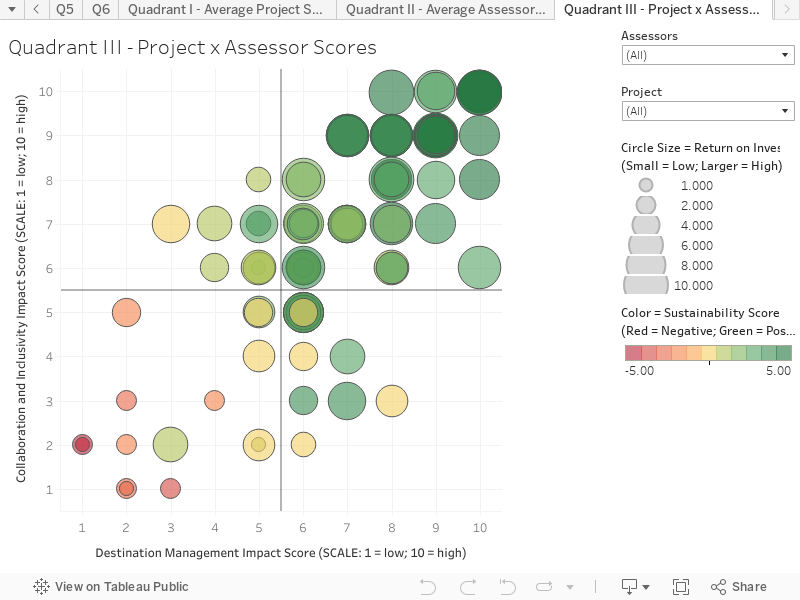
This chart shows provides the full breakdown between projects and Assessors. This is controlled by the drop-down filters on the upper right-hand corner.

  • This allows for exploring the result of specific projects and seeing the distribution of Assessor results. Some are closely clusters, and some are more spread. This helps the Assessment team see where there is high level of agreement, or where there may be divergent views. This can help identify important discussions to better understand perspective about various projects.
  • Also, you can select an individual Assessor and see how their project scoring is distributed.

You can hover over the circles in the chart to reveal more information.

Key things to note:

  • To gain an insight into how this visualization helps see underlying patterns and data, select ‘ALL Assessors’ and ‘Countywide bike and pedestrian trail plan’. You can see that most of the Assessors are in common agreement, and the project scores high on all the criteria. Compare this to how all the Assessors scored ‘Tourist Trolley’.
  • The responses to the ‘Roller Coaster and amusement park’ show a low result and a negative score on the sustainability impact score. Projects like ‘Trail-heads and signage’ show a relatively high sustainability score and Destination Impact and Collaboration and Inclusivity Score.
  • These results from the BETA testing shows the scores that help quickly identify projects that best suit the priorities developed by the stakeholder engagement process.

More Information

If you have questions about the Tillamook County Tourism Investment Strategic Action Plan project, please contact:

David Beurle, CEO Future iQ
Phone: + 1 612 757 9190
david@future-iq.com