
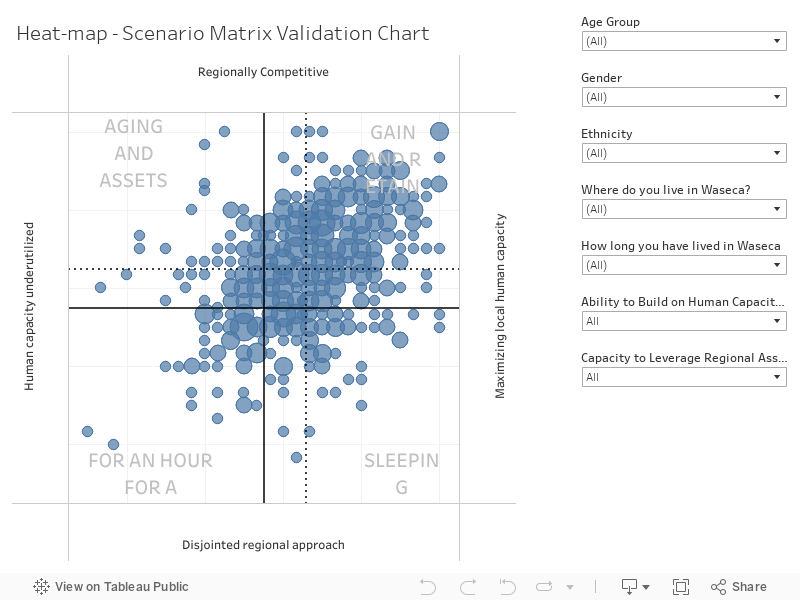
This chart provides a method to validate the preferred future created via the heat maps. This ‘Scenario Matrix Validation Chart’ is created by building a preferred future from the answers to the ‘Critical Issues’ questions. These ‘Critical Issues’ questions are subsets of the scenario axes, and by recombining each person’s answers we create a unique X, Y average. This approach generates a notional Preferred Future, but one based on likely response to issues and expected behaviour in real-life. This provides a validation of the Preferred Future response based on the heat map diagram.
Heat-map – Scenario Matrix Validation Chart
Key things to note:
- The distribution shown is from individual responses with no cohort averaging, thus creating a larger spread.
- There is a significant concentration of responses in a location that reflects the Preferred Future as defined in the heat maps.
- Hovering over each data point will show the number of responses in that location. Additional filters are on the right-hand column.
More Information
For more information, and to engage in further discussion regarding the Waseca Vision 2030 project, please contact:
Danny Lenz, City Manager
City of Waseca
508 S. State Street
Waseca, MN 56093
Tel: 507.835.9700
dannyl@ci.waseca.mn.us
Get involved! Sign up at the Waseca Minnesota Project Link: http://wasecavision2030.com