
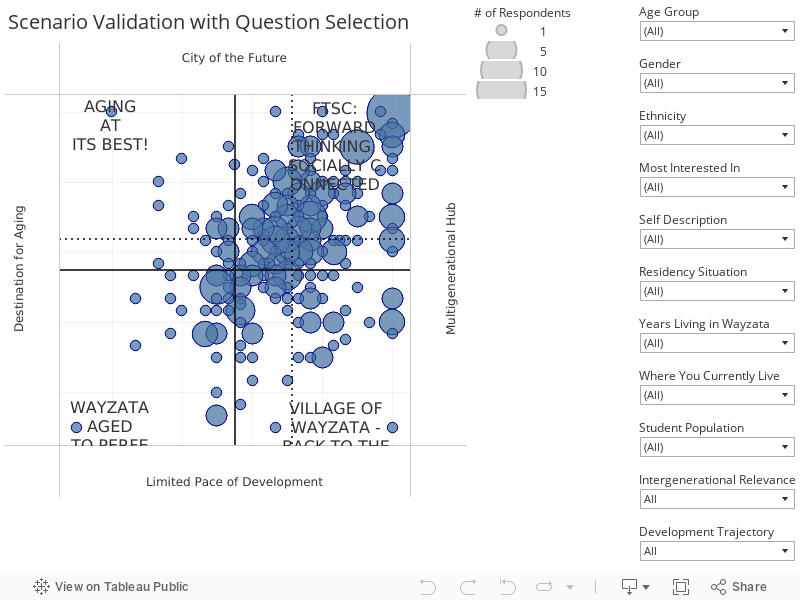
This chart provides a method to validate the preferred future created via the heat maps. This ‘Scenario Matrix Validation Chart’ is created by building a preferred future from the answers to the ‘Critical Issues’ questions. These ‘Critical Issues’ questions are subsets of the scenario axes, and by recombining each person’s answers we create a unique X, Y average. This approach generates a notional Preferred Future, but one based on likely response to issues and expected behaviour in real-life. This provides a validation of the Preferred Future response based on the heat map diagram.

Heat-map – Scenario Matrix Validation Chart
Key things to note:
- There is a significant concentration of responses in a location that reflects the Preferred Future as defined in the heat maps.
- Hovering over each data point will show the number of responses in that location. Additional filters are on the right-hand column.
More Information
For more information, and to engage in further discussion regarding the Wayzata 2040, Sailing Ahead project, please contact:
Mr. Jeff Dahl, City Manager
City of Wayzata
600 Rice Street East
Wayzata, MN 55391
Tel: 952.404.5300
jdahl@wayzata.org