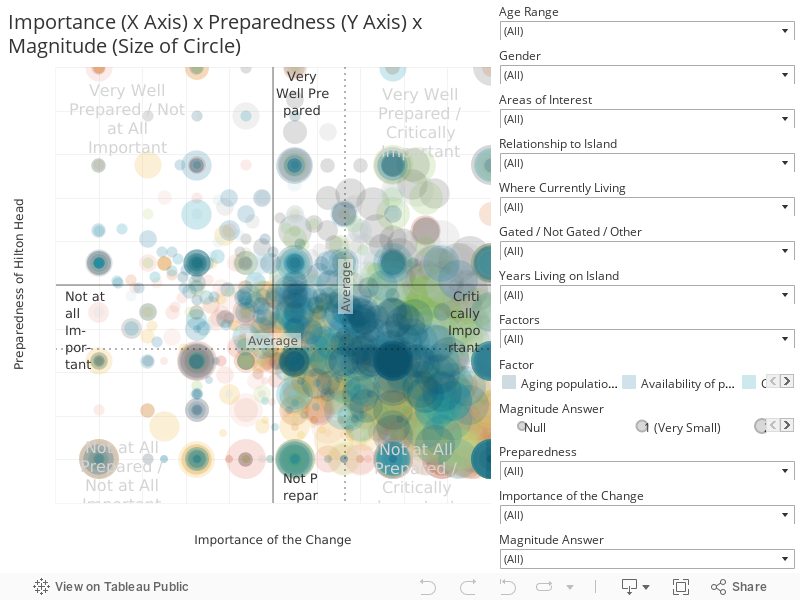
This visualization shows all response data as it relates to all 14 factors, but it is split out into age, gender and magnitude cohorts. The responses are categorized in two axes – importance of factor and preparedness of Hilton Head Island to deal with the factor. The size of the circle represents the magnitude of the impact as rated by each respondent.
This chart combines responses to three questions to create an interactive scatter plot. The chart is structured as follows:
- X-Axis is the response to the question “Please indicate how important you think the following topics are to the future of Hilton Head Island” The scale is 1-Not Important, 10 –Critically Important
- Y-Axis is the response to the question “How well prepared is Hilton Head Island to adapt to these changes?” The scale is 1-Not at all prepared, 5 –Very well prepared
- Size of the dot is the response to the question “Please score what you believe will be the overall impact or magnitude of the changes within each of the topic areas” The scale is 1-Very Small, 10 Very Large
This chart presents the result distribution based on all respondents.