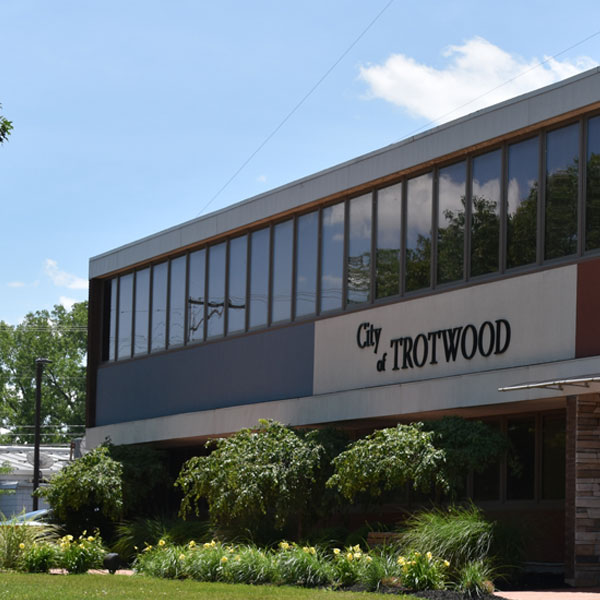
This platform gives access to the data gathered in 2019, during the community engagement phase of the City of Trotwood Strategic Planning project.
On this engagement data visualization portal, you can explore how people viewed a range of issues and factors. On some charts, there are filters on the right-hand side. These filters allow you to explore responses by different cohorts within the community. In some charts, you can hover over data points to reveal specific information. This visualization is intended to allow you to explore the data set and see what your fellow residents and stakeholders think about a range of key issues.


