Key Factors – Age Cohort Data

Key Factors – Age Cohort Data
Nature of Impact (X Axis) x Preparedness (Y Axis) x Importance of Topic (Circle Size)

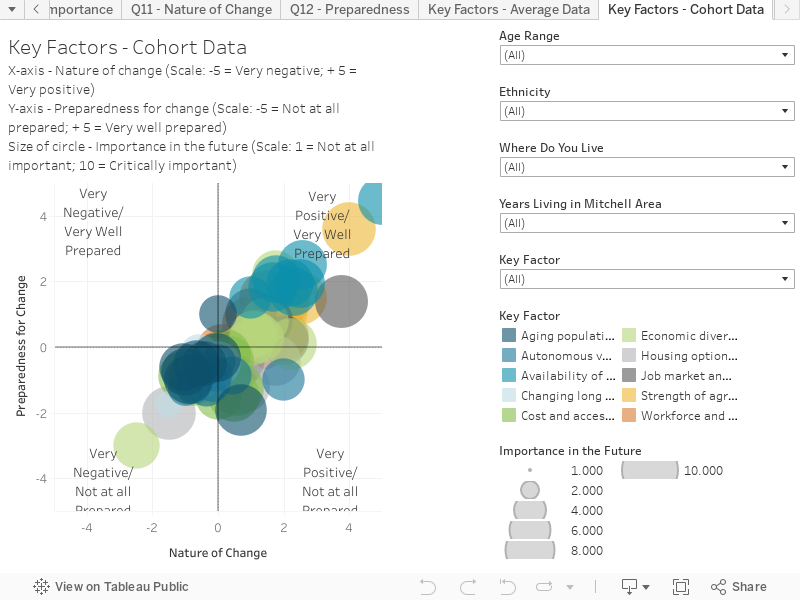
This chart explore the responses based on age cohorts. Like in the ‘Key Factor – Average Data’ chart, it combines responses to two questions to create an interactive scatter plot. This visualization shows response data as it relates to all 10 topics. This chart presents the result distribution based on age of Cohorts of respondents.

The chart is structured as follows:

  • X-Axis is the response to the question “Do you think expected changes in each of these factors, will be positive or negative for Mitchell?”. The scale is: -5 = Very negative; 0 = Neutral; +5 = Very positive
  • Y-Axis is the response to the question “How well prepared is Mitchell to adapt to changes in these issues?”. The scale is: -5 = Not at all well prepared; +5 = Very well prepared
  • Size of the circle is in response to the question “How important do you think the following factors will be to Mitchell in 2040?”. The scale is: 1 = Not Important; 10 = Critically Important

Key things to note:

  • For each factor, you will be able to look at the concentration of responses between cohorts – some factors count on a very concentrated set of answers, showing agreement between cohorts of respondents. Other factors show a bigger spread, which shows that respondents perceive these issues differently.
  • For the factors where there is not a great concentration, filter by areas of interest, age, or residence location and see how the cloud of responses changes.

More Information

For more information about Forward 2040, please contact:

Stephanie Ellwein, City Administrator
City of Mitchell City Hall
612 North Main Street
Mitchell, SD 57301
Tel: 605.995.8143
sellwein@cityofmitchell.org

More Information

For more information about the overall project:

Heather Branigin, Project Manager
Future iQ
heather@future-iq.com