Perception of Trends – All Data (Average results)

Nature of Impact (X Axis) x Scale of Impact of Major Trends (Y Axis) x Number of Respondents (Circle Size)

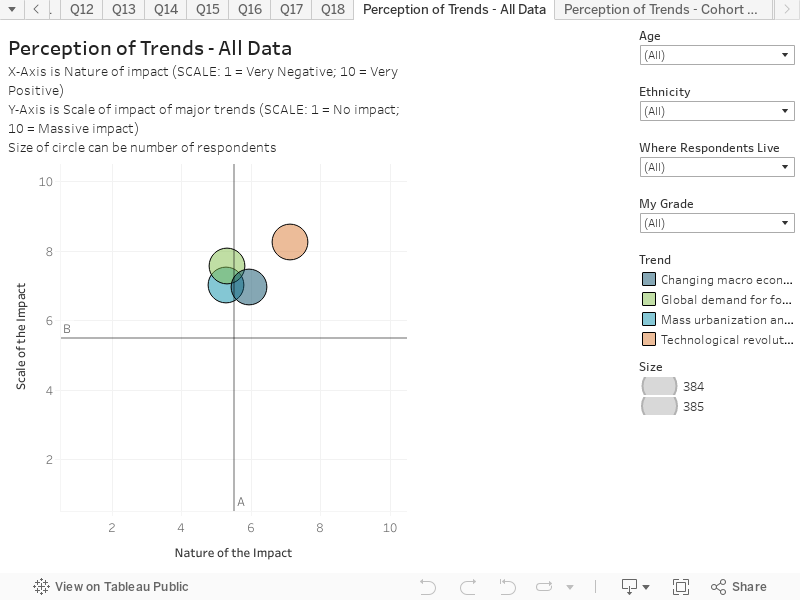
This chart combines responses to two questions to create an interactive scatter plot. This visualization shows response data as it relates to all 4 topics. This chart presents the average results based on all respondents.

The chart is structured as follows:

  • X-Axis is the response to the question “What do you think will be the nature of the impact (Negative or Positive) of these macro trends on your life and future prospects? Scale: 1 = very negative; 10 = Very positive.
  • Y-Axis is the response to the question “In the next 10 years, how large an impact do you think the following emerging trend areas will have on your life and future prospects?Scale: 1 = No impact; 10 = Massive impact.

Key things to note:

  • The students recognized that these trend areas will have significant impact on their lives and future prospects. In most cases the ‘Nature of Impact’ was judged to be balanced, except for Technological Revolution, where they perceived a very strong positive impact.
  • The scale of impact was large on all trend areas, again, more so with the Technological Revolution trends.

More Information

For more information about Forward 2040, please contact:

Stephanie Ellwein, City Administrator
City of Mitchell City Hall
612 North Main Street
Mitchell, SD 57301
Tel: 605.995.8143
sellwein@cityofmitchell.org

More Information

For more information about the overall project:

Heather Branigin, Project Manager
Future iQ
heather@future-iq.com